Choose data points
Budget integrity
Built from SEA Casino Budget — Acquisition Launch Controls, including the supplied SMS update. All 17 workbook sections and 1,640 designated inputs remain available.
Your scenario workspace
Changes autosave in this browser. Export scenario files to share or back up a plan. The published source stays intact; cross-device team synchronization is not configured.
Bear. Normal. Bull.
Compare operating outcomes while keeping funding and the operating plan constant. Default profiles: Bear uses Downside, Normal uses Planning, and Bull uses the Test benchmark. Edit each profile and inspect the effective assumptions below.
One source model for markets, acquisition, player economics, people and cash. Change a driver in All assumptions or a dedicated control below; the same workbook formulas recalculate the forecast.
| Market | Launch | FTDs · 24M | Deposits · 24M | GGR after bonus | Acquisition | Acquisition / FTD | Contribution |
|---|
Includes the SMS update and individual channel activation controls. Forecasts are planning assumptions, not recorded trading results. All 17 workbook sections, including historical evidence, player values, review checks and resource notes, are available in Full budget detail.
The earlier September 22 launch-plan illustration uses a different scope and is not combined with this current five-market budget. Unconfirmed prices and measured CAC remain explicitly identified in the source notes.
Scenario changes autosave in this browser. Export a scenario to share or back it up. They do not overwrite the published baseline or sync to other devices.
Forecast assumptions with explanations of what they change and when they apply. Percentages are entered as percentages (35 = 35%). Optional country overrides can be left blank to inherit case assumptions. Staff prices and schedules are managed in People & payroll and Gantt. Obsolete and reference-only controls have been removed from this library; original records remain in Full budget & evidence.
| Assumption | Field / period | Scenario value | Source value | What it changes and when it applies |
|---|
Enable, pause or move existing shared overhead. Leave monthly USD blank to use the source stage amounts, or enter a new fixed monthly quote. Additional shared costs flow through operating profit, tax reserves, country allocations and cash. These amounts are incremental; avoid adding costs already included in staffing, platform fees or channel budgets.
| Cost | Enabled | Project start | Project end | Monthly USD override |
|---|
Revenue-linked platform fees, commissions, bonuses and payment fees remain linked to their drivers in All assumptions. Staff costs follow individual hiring schedules.
Every populated source row is available, including monthly acquisition by channel, active players, average player values, bonus wallets, country cash, staffing and model checks. Values reflect the current scenario. Expand Calculation to trace a derived value; edit its driver in All assumptions.
Save a named snapshot before experimenting. Loading it restores every market, channel, staffing and assumption change and recalculates with the current model. Snapshot totals below were recorded when saved; the project overview compares the active scenario with the published source baseline.
| Scenario | 24M operating profit | Closing cash | Peak funding need | Actions |
|---|
Stored locally in this browser, not shared server storage. Export files to retain portable copies. Reset Model restores the default working plan. Recent changes can be restored from History.
| Financial Metric (USD) | 12 Months | 24 Months | % of Total GGR | Key Operational Driver |
|---|
Advanced channel activation controls
Set earliest local eligibility; use the market Gantt for scheduling. Existing volume ramps, contact caps and approval gates still apply. Local month 1 is the market launch month. These controls do not restart growth schedules.
Reported campaign spend is a benchmark, not an extra forecast charge. Sending costs use the supplier price and the workbook’s existing FX assumption. Forecast conversion uses the selected response case and its editable multiplier.
| Market / service | USD / message | PHP / message | Use |
|---|
OTP is separate from marketing SMS. Marketing SMS $0.008 and RCS $0.016 have unconfirmed country coverage. India and Bangladesh remain reference quotes; no new markets or unprovided OTP volumes are added.
Set the estimated monthly price per person here. Add headcount, market, start/end dates and responsibilities in the Gantt schedule. Changing a price updates hires linked to that price; it does not add headcount. Startup cost covers computers and other equipment: once per person in their scheduled start month, without payroll load. Different market rates remain separate. Departments are sorted by salary, cheapest first; unquoted roles follow. Existing roles outside the new catalogue are retained under Other existing roles so scheduled costs are preserved.
Choose market graph data points
Player lifetime value
Modeled per acquired depositing player, including players who never return. Active months are not account age. These assumptions also drive the monthly forecast.
Monthly market plan
All 24 months. Scroll horizontally; roughly six months fit at once. Totals use weighted ratios or closing balances where appropriate.
How scheduling connects to the budget
Drag bars or focus one and use arrow keys to move by whole months. Click a label or bar to edit exact dates, headcount and costs. Drag the right edge of a staff or cost bar to change its end date. Market moves preserve local schedules; activity moves preserve the offsets between their channels and dated staff. Items may move beyond the 24-month forecast when a market is delayed. Dashed bars are excluded, disabled or unplanned; moving them does not activate them.
Staff are grouped by role for planning; the source does not specify mandatory activity-to-hire launch dependencies. Acquisition dates represent earliest eligibility, not guaranteed spend. Existing volume, approval and founder affordability gates remain in effect. Shared operations apply across markets, and upfront setup cash is reported at the opening of Month 1. Edits autosave in this browser and are included in scenario exports.
Org. Chart & costs
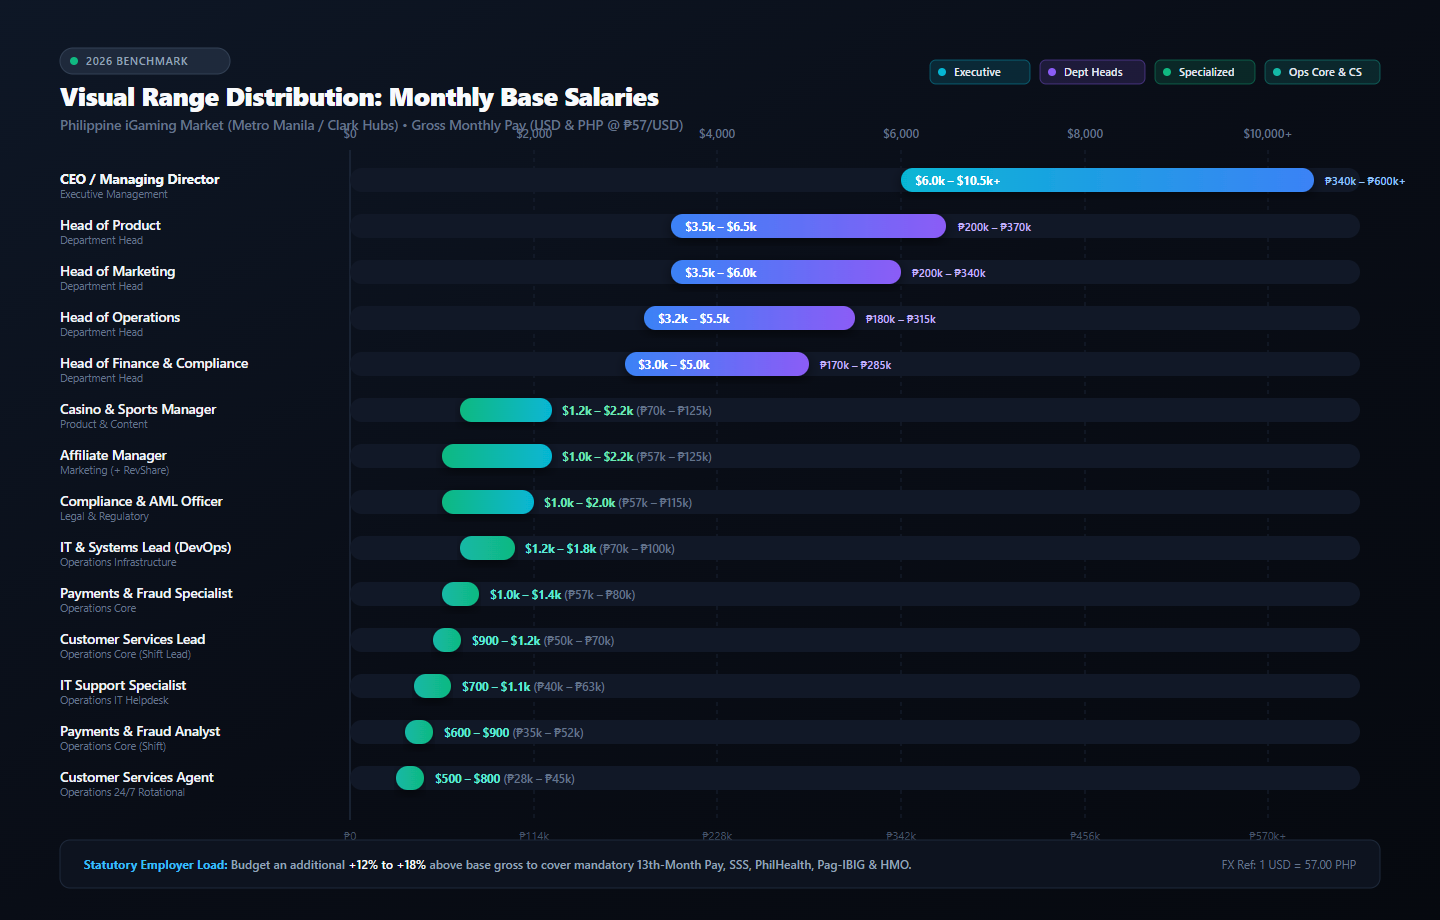
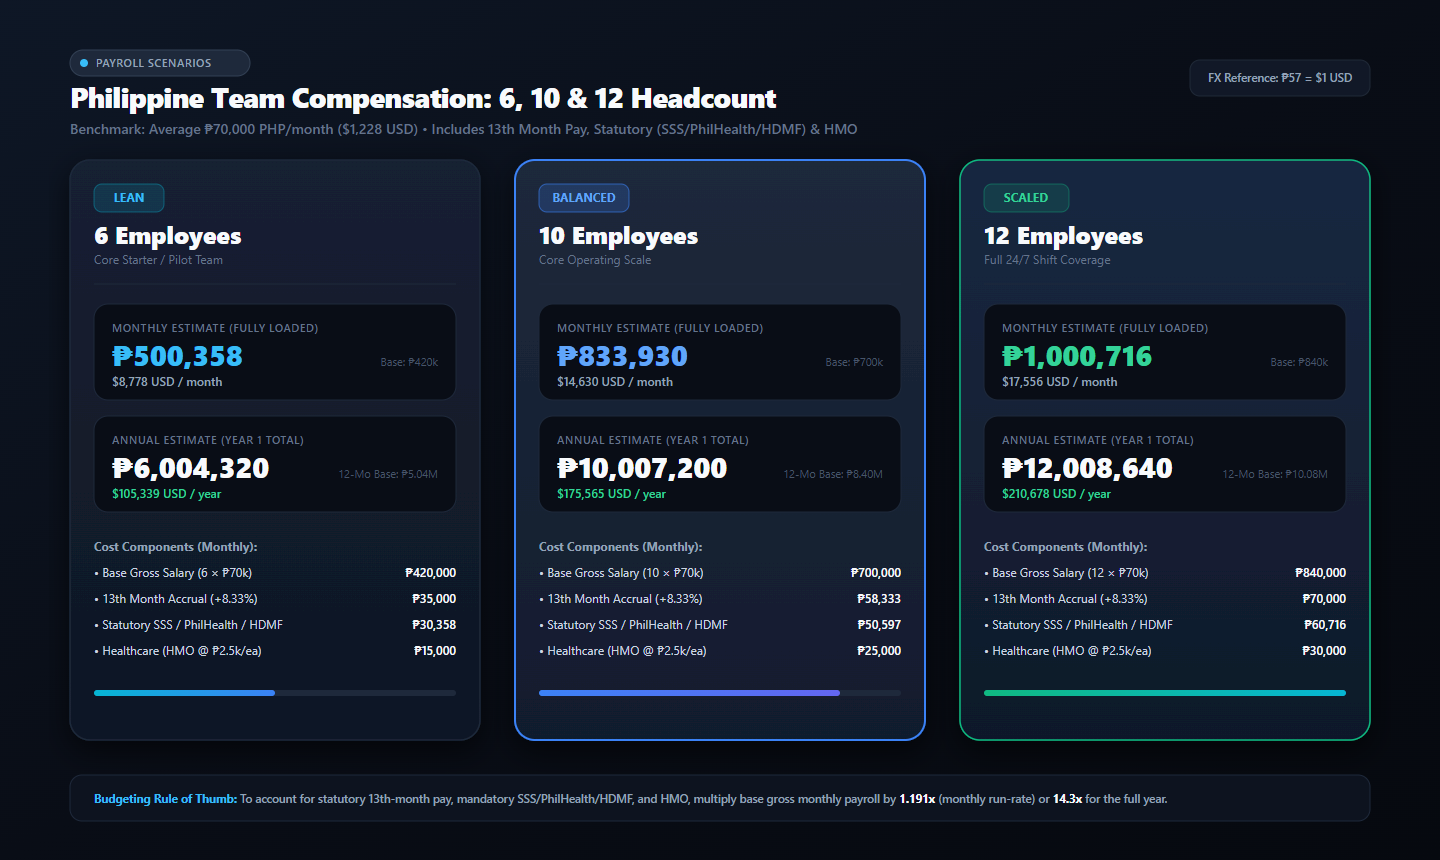
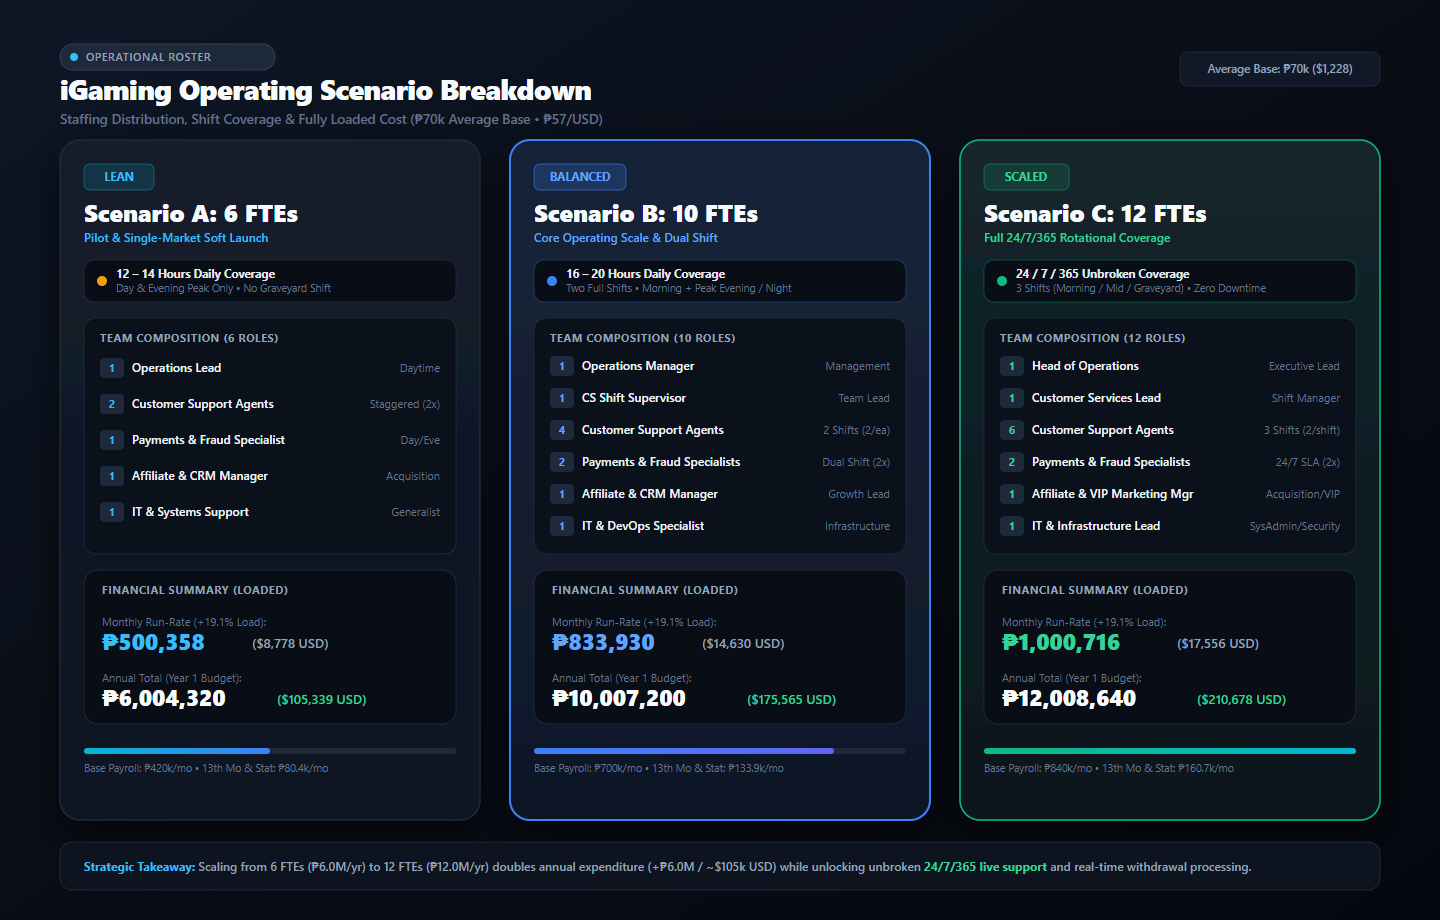
Comprehensive operational hierarchy, 2026 Philippine iGaming salary structures, and 6 / 10 / 12 FTE headcount budget scenarios.
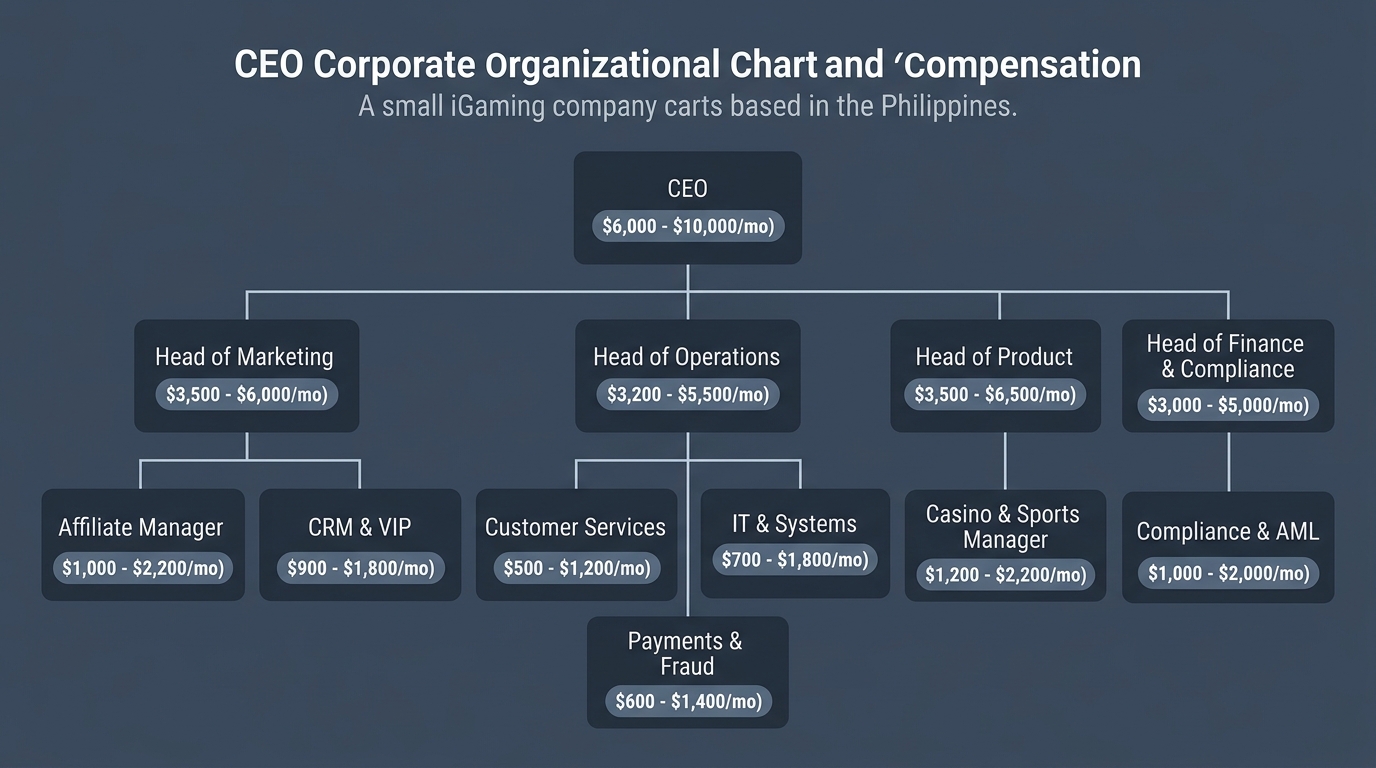
| Role / Position | Department | Min Base (PHP) | Midpoint (PHP) | Max Base (PHP) | Loaded / Mo (PHP) | Loaded / Mo (USD) |
|---|---|---|---|---|---|---|
| General Manager / CEO | Executive | ₱180,000 | ₱235,000 | ₱300,000 | ₱282,385 | $4,954 |
| Head of Operations / COO | Operations | ₱130,000 | ₱170,000 | ₱220,000 | ₱204,970 | $3,596 |
| Head of Marketing / CMO | Marketing | ₱120,000 | ₱155,000 | ₱200,000 | ₱187,115 | $3,283 |
| Compliance & Legal Manager | Legal | ₱90,000 | ₱120,000 | ₱160,000 | ₱145,440 | $2,551 |
| Senior IT / Systems Admin | IT & Systems | ₱80,000 | ₱105,000 | ₱140,000 | ₱127,555 | $2,238 |
| Payments & Fraud Manager | Finance | ₱75,000 | ₱100,000 | ₱130,000 | ₱121,600 | $2,133 |
| VIP Account Manager | Retention | ₱65,000 | ₱85,000 | ₱115,000 | ₱103,735 | $1,820 |
| CRM & Retention Specialist | Retention | ₱60,000 | ₱80,000 | ₱110,000 | ₱97,780 | $1,715 |
| Digital Marketing / Acquisition | Marketing | ₱55,000 | ₱72,500 | ₱95,000 | ₱88,848 | $1,559 |
| Customer Support Shift Lead | Support | ₱45,000 | ₱58,000 | ₱75,000 | ₱71,578 | $1,256 |
| IT Helpdesk / NOC Specialist | IT & Systems | ₱40,000 | ₱52,500 | ₱70,000 | ₱65,028 | $1,141 |
| Content & Social Media Specialist | Marketing | ₱40,000 | ₱52,500 | ₱70,000 | ₱65,028 | $1,141 |
| Payments / KYC Officer | Finance | ₱38,000 | ₱50,000 | ₱65,000 | ₱62,050 | $1,089 |
| Customer Support Agents (x3 shifts) | Support | ₱32,000 | ₱42,000 | ₱55,000 | ₱52,522 | $921 |
Player Segmentation & overview
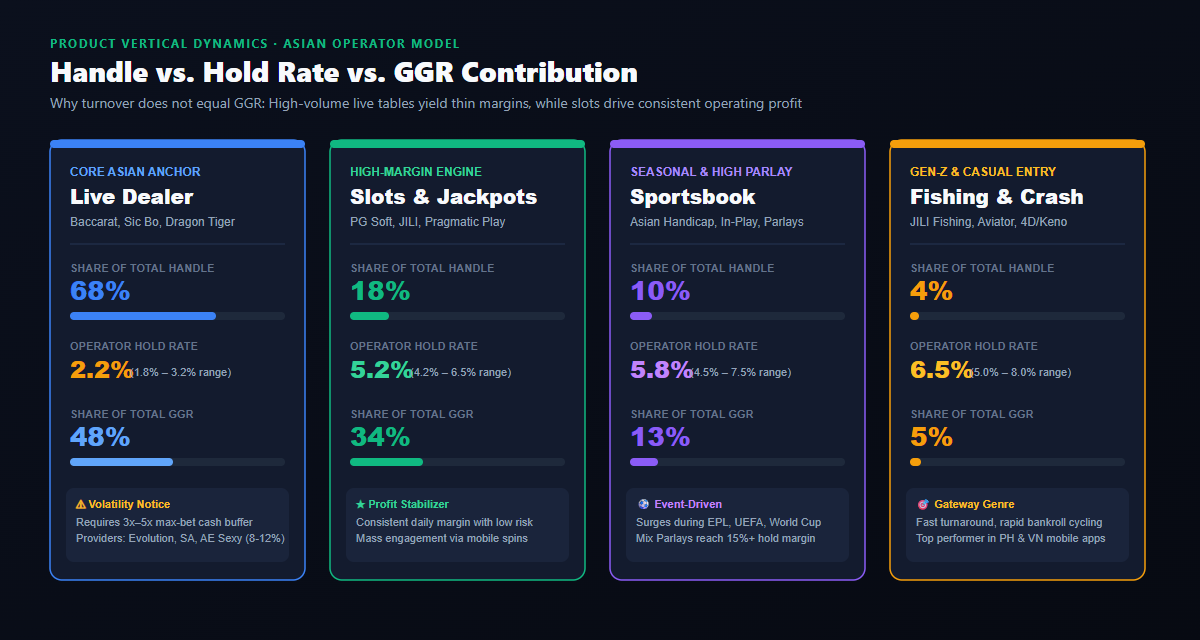
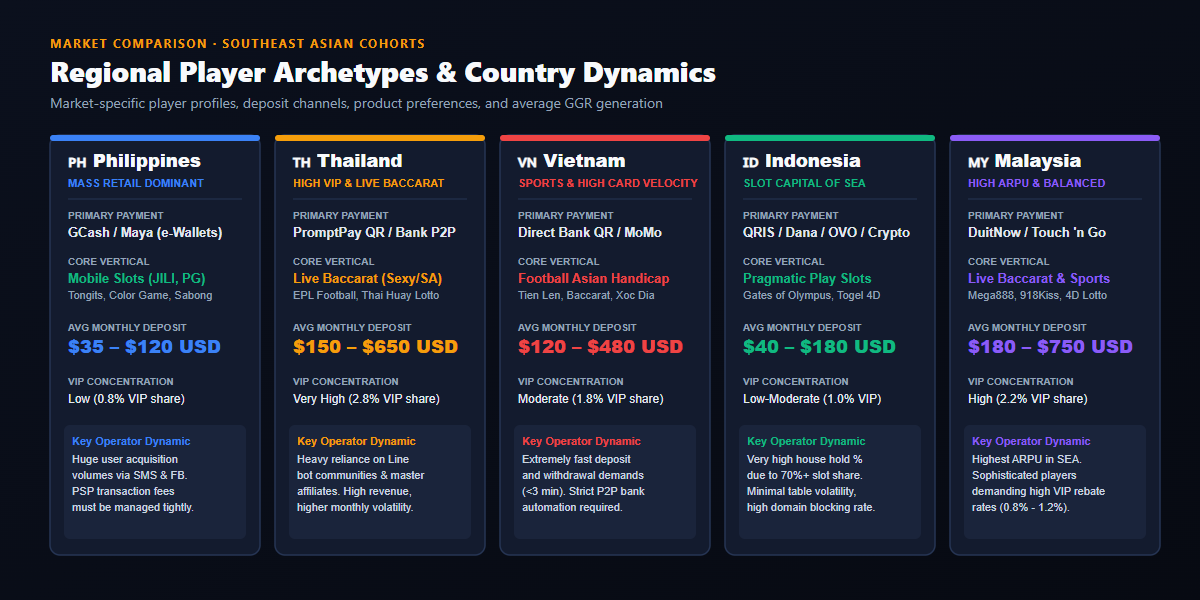
Comprehensive breakdown of Gross Gaming Revenue (GGR) power-law distribution, VIP whale dynamics, product hold rates, and country-level player cohorts across Southeast Asia.
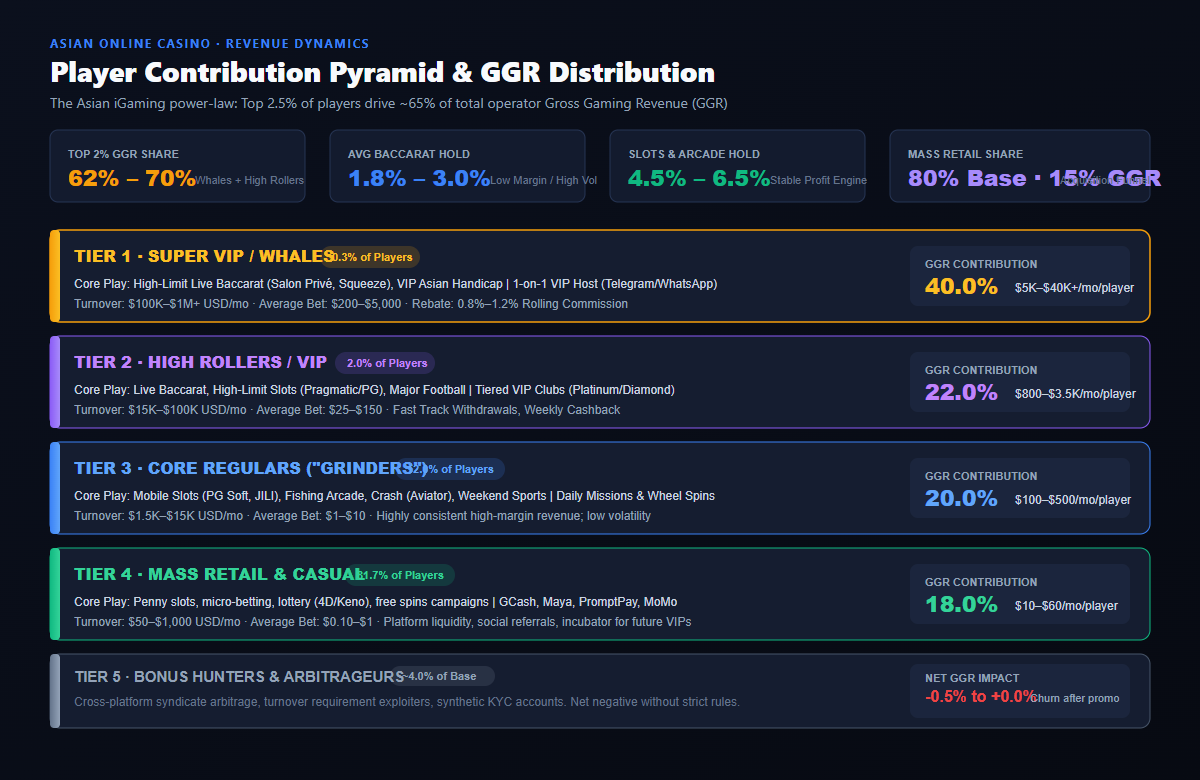
| Player Tier | % of Active Base | % of Turnover | % of Total GGR | Monthly GGR / Player | Monthly Handle | Primary Game Affinity | Servicing & CRM Model |
|---|---|---|---|---|---|---|---|
| Tier 1 · Whales / Super VIP | 0.2% – 0.5% | 48% – 55% | 35% – 45% | $5,000 – $40,000+ | $100K – $1.0M+ | Salon Privé Live Baccarat, High Handicap | 1-on-1 VIP Host (Telegram), 0.8%–1.2% Rolling Rebate, Crypto/P2P |
| Tier 2 · High Rollers / VIP | 1.5% – 2.5% | 20% – 25% | 20% – 25% | $800 – $3,500 | $15K – $100K | Live Baccarat, High Slots, European Football | Tiered VIP Club (Platinum/Diamond), Fast Track Cashouts, Weekly Cashback |
| Tier 3 · Core Regulars ("Grinders") | 10% – 15% | 15% – 20% | 18% – 22% | $100 – $500 | $1.5K – $15K | Mobile Slots (PG Soft, JILI), Fishing Arcade | Daily Missions, Wheel Spins, Leaderboard Tournaments, Level-Up Perks |
| Tier 4 · Mass Retail & Casual | 75% – 82% | 5% – 10% | 10% – 15% | $10 – $60 | $50 – $1,000 | Penny Slots, Aviator/Crash, 4D Lotto, Tongits | Automated SMS/Push, Deposit Match Bonuses, Local e-Wallets (GCash/Maya) |
| Tier 5 · Bonus Hunters & Arbitrage | 3% – 5% | ~4% | -0.5% to 0.0% | -$20 to $0 | $200 – $2,000 | Low-volatility slots, Opposite sports bets | Automated KYC gating, strict 15x–25x rollover, IP & Device fingerprinting |
Operator Capital & Risk Rules
Key balance sheet and operational rules for Asian iGaming executives:
- Working Capital Reserve: Maintain a liquid cash buffer equal to 3x to 5x the maximum single-hand table limit to withstand VIP statistical winning runs.
- Provider Rev-Share Impact: Live casino feeds (Evolution, SA Gaming, Sexy Baccarat) take 8% to 12% of GGR, while slot providers take 10% to 14%. Game mix directly determines net platform take.
- Payment Gateway Friction: In mass-market regions (Philippines, Indonesia), high flat-fee PSP transactions can erode up to 15% of small deposit margins. Dynamic routing is mandatory.
Retention & CRM Allocation
How high-performing Asian operators allocate marketing and staffing resources:
- 65% of CRM Budget: Focused exclusively on the top 2.3% of players (bespoke loss-back, milestone luxury gifts, private bank corridors).
- 25% of CRM Budget: Dedicated to Core Regulars via automated gamification (daily reload matches, leaderboard races).
- 10% of CRM Budget: Programmatic SMS, WhatsApp bots, and push notifications for retail reactivation and anti-churn campaigns.